I stopped posting the monthly Pinehurst crime map a while back because the city’s website changed in a way that didn’t let me collect the data. I heard that soon-ish there will be a way to collect data by SPD beat by some date span, maybe quarter, but I can’t remember if it’s also by month. So then I’ll be able to present some data, though this source isn’t a map; it’ll just be numbers.
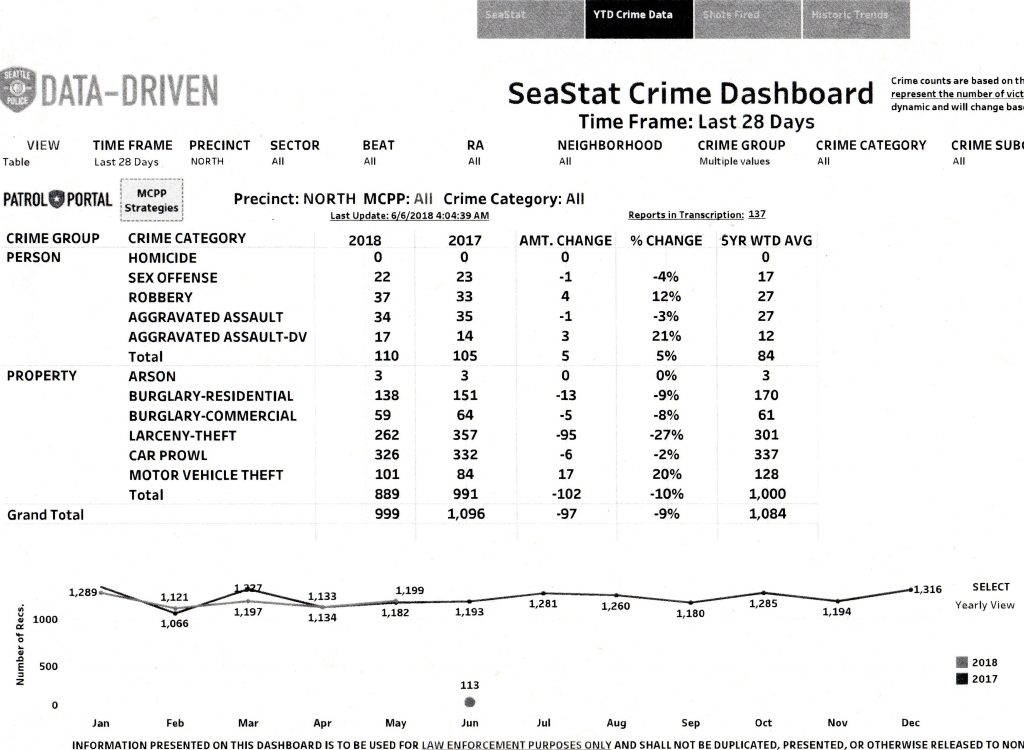
In the meantime, here’s a chart from the last SeaStat meeting. SeaStat is a bi-monthly meeting of all the SPD bigwigs to look at crime data. This chart compares property and person crimes in the last 28 days to the same categories and same 28 days a year ago. Please note that it is for all North Precinct, not Pinehurst.
I’m not sure what is accomplished by comparing the current month to the same month last year. Maybe more informative for us is looking at the bottom graph that shows number of crimes month by month. It is trending up. Again, I don’t know if this is true in Pinehurst, since the chart is for all North Precinct.

Leave a Reply