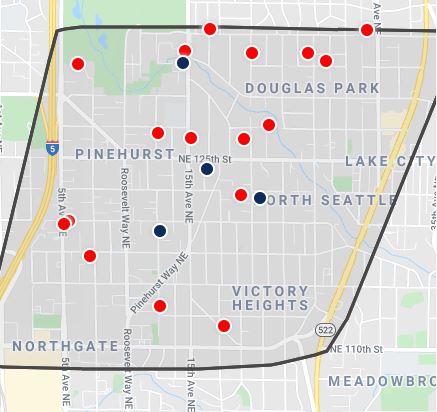
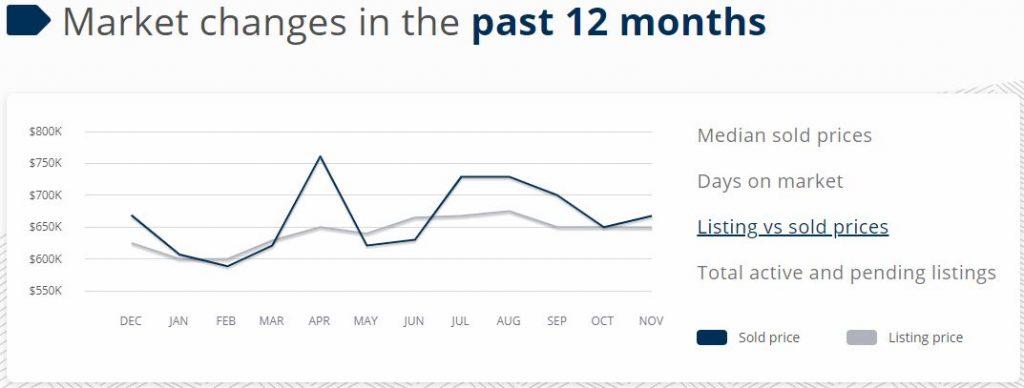
There is some interesting info about trends in Pinehurst real estate. The website shows November compared to October home prices for 30, 60 or 90 days. The map might be initially zoomed in, so you will see the roughly Pinehurst outlined area by zooming out. You can change options for both the graph and the map. Note that in the market changes section below the graph, the numbers are for November and the percentages are percent change. Also, ‘Days to Sell’ are from listing to closing.
The customized data view is brought to us by neighbor John Lombard, Windermere Real Estate.
Click here to play with the data.
Sample data:

Leave a Reply